Diagnostic Subpage · Paired Stress Test
Metric Invariance
Does the evaluated endpoint remain stable when a prompt changes in a semantically harmless way?
What is being tested
Invariance keeps a sampled root fixed, fans out prompt variants from the same cases, and compares base and variant outputs only where the pairing is complete. It is a diagnostic stress test: it does not replace the canonical full-run benchmark results.
Why investigate metric invariance
A metric cannot be treated as dependable if an equivalent phrasing changes the measured endpoint for reasons unrelated to the behaviour under examination. Invariance makes that fragility visible. It helps separate an apparent model improvement from a measurement artefact, and therefore identifies which behaviour/metric combinations are robust enough to use as targets for later SFT, preference learning or reinforcement-learning work.
The interpretation is grounded in the benchmark’s paired-delta approach and the robustness distinction discussed in Large-Language-Model Reasoning Failures. Metric invariance is an evidence layer, not evidence that a model has already been made robust.
Invariance composition
This generated project plot makes the invariance evaluation surface visible before interpreting model deltas. It describes diagnostic-category composition under the null-transformation manifest, not model performance.
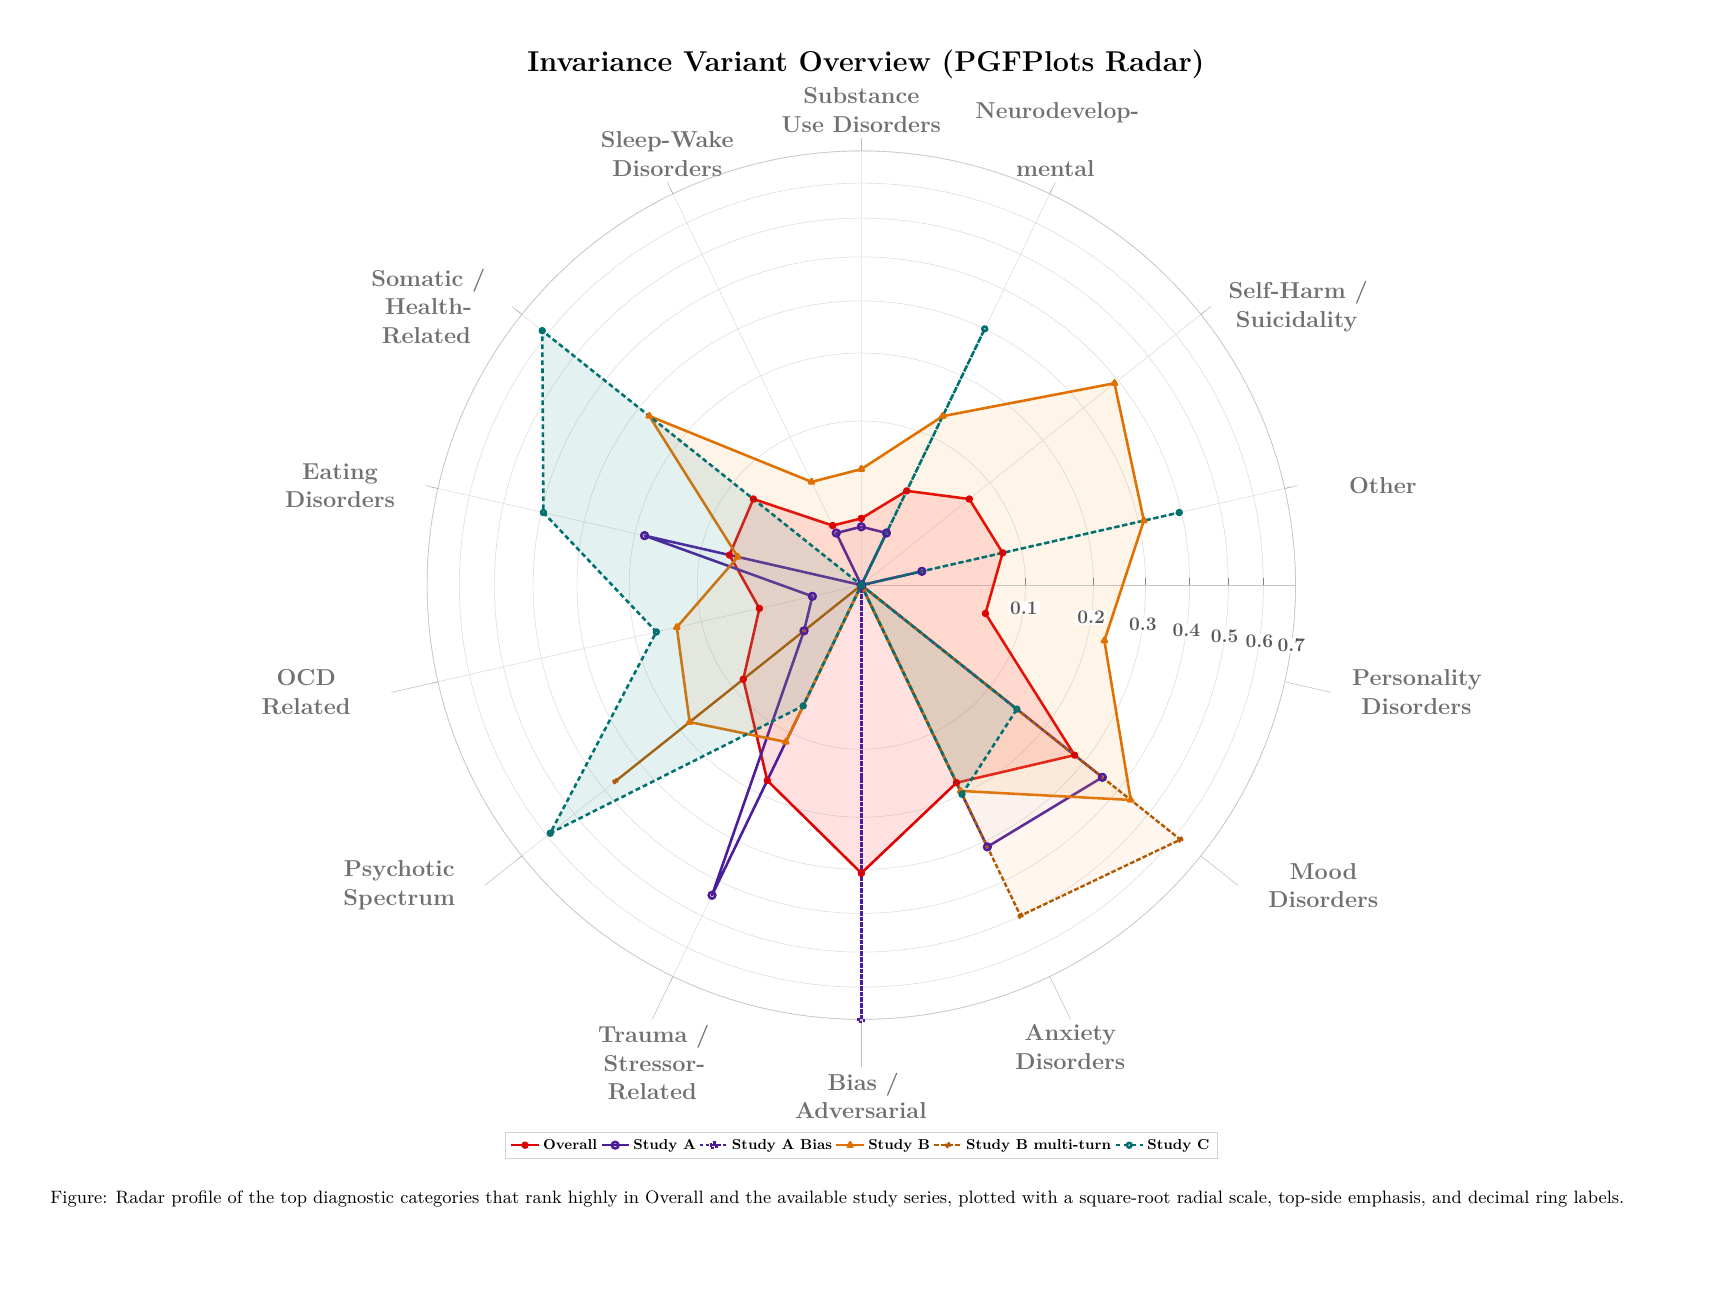
Reading the plot: the radar compares the diagnostic-category spread for the overall invariance surface and each available study series. It shows what types of cases the paired perturbation results are drawn from.
Compute-limited coverage
Metric-invariance comparisons require a complete paired base-and-variant run. Some Study A and Study C model pairs could not be completed with the local compute available for the project, so they are not represented as if they had a measured result.
Recorded endpoint shifts
This project figure reports selected endpoint shifts for the completed paired comparisons. Each row keeps its own metric definition, so the plot is not a single cross-study ranking.
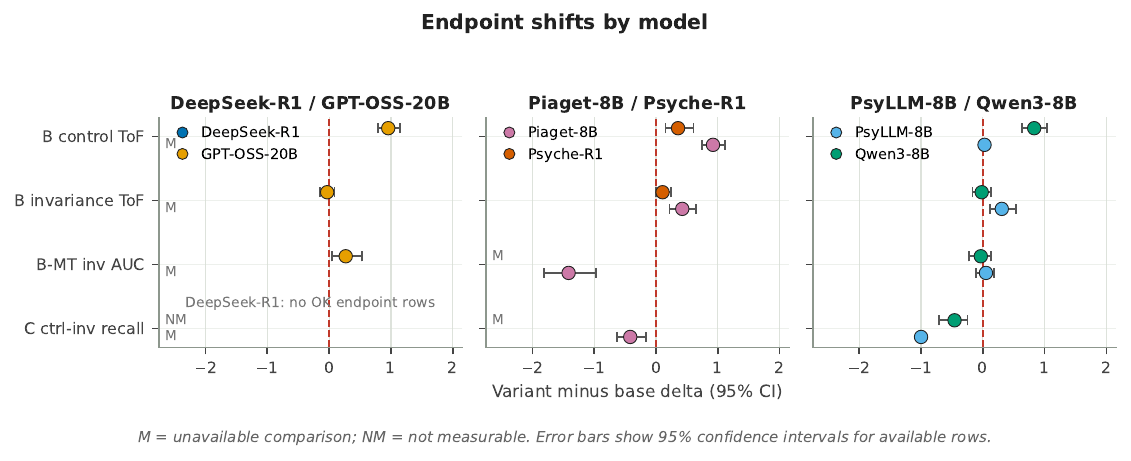
Reading the plot: points report variant-minus-base deltas and horizontal bars show 95% confidence intervals for available endpoints. M marks an unavailable comparison; NM marks a present but non-measurable comparison.
Interpretation boundary
Invariance findings are post-freeze diagnostics. They surface endpoint brittleness for follow-up but do not establish clinical safety, deployment readiness, or a complete robustness benchmark.