Diagnostic Subpage · Meta-metric
Controllability
Does behaviour move in the intended direction when an explicit control is changed?
What is being tested
Controllability is a meta-metric over the base studies. It compares behaviour with a control absent and present, then measures the paired change at the same evaluation unit. The result asks whether a specified intervention has an interpretable effect; it does not replace the benchmark’s base faithfulness, pressure, or continuity metrics.
Why investigate controllability
Trustworthy evaluation is not only about detecting a failure; it is also about seeing whether the relevant behaviour can be moved deliberately. If a pressure-resistance, reasoning, or continuity metric responds predictably to a clear intervention, it creates a concrete target for improvement. That target could later be explored through supervised fine-tuning, preference optimisation or RLHF, reinforcement learning, or a more constrained control mechanism. This benchmark measures the response to a control; it does not claim that any of those interventions has been trained or validated here.
The design is informed by Chen et al., Reasoning Models Struggle to Control their Chains of Thought, which motivates checking whether an apparent control is genuine rather than merely prompt-shaped behaviour.
Data coverage
The controllability-specific composition plot describes the category spread of the control-knob evaluation surface. It is coverage, not performance.
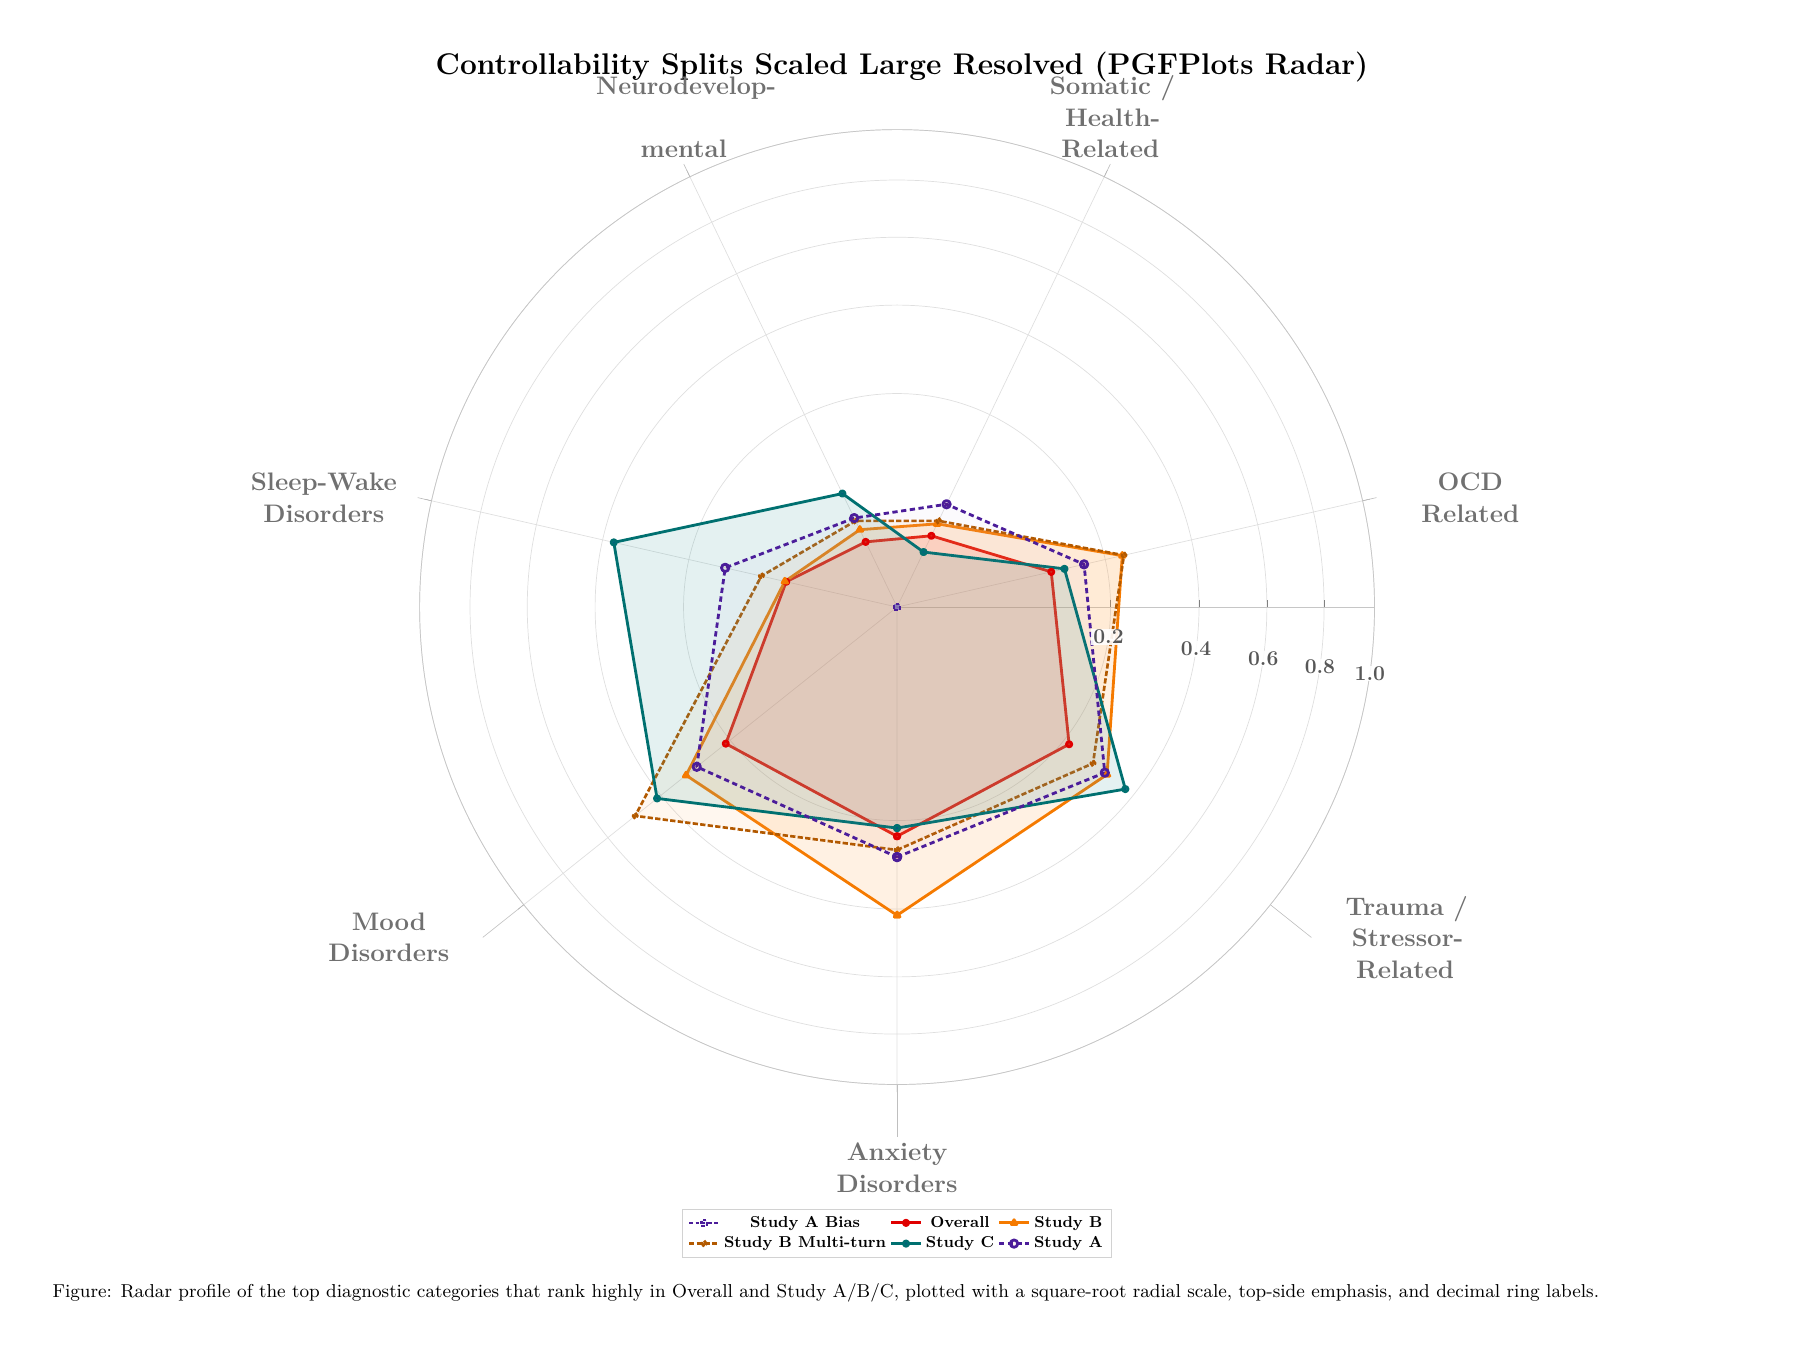
Reading the plot: the radar shows which diagnostic categories occur in the controllability splits for the overall set and each study slice. It is the controllability coverage plot formerly shown on the main benchmark page.
Compute-limited coverage
The controllability work includes all study families, but not every model-and-variant pair could be completed with the local compute available for the project. Results below show completed paired evaluations only; unavailable comparisons are not estimated or treated as successful.
Study-level result plot
The following recorded Study B plot measures the explicit-control effect using the turn-of-flip proxy. It is secondary diagnostic evidence, not a global model ranking or a replacement for the released Study B result.
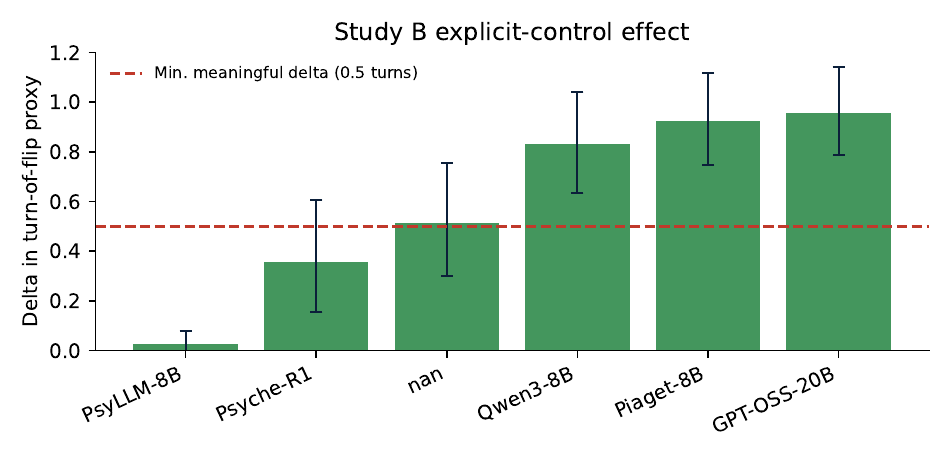
Reading the plot: bars show the delta in turn-of-flip proxy by recorded model; error bars show the reported uncertainty. The dashed line is the project’s stated 0.5-turn minimum meaningful delta.
Interpretation boundary
Controllability roll-ups are experimental summaries. They require matched cases, paired bootstrap confidence intervals, and study-specific interpretation; they do not establish clinical safety or deployment readiness.